

or How to Diagnose Linux Performance Problems in Under 60 Seconds
Most people are using top all wrong. They scan everything, understand nothing, and leave more confused than when they started. You don’t need to read the whole screen. You really only need these 5:
- Load Average What it tells you about pressure over time, not just right now.
- CPU Breakdown User vs system vs wait, and why idle does not always mean healthy.
- Memory Pressure Why “used” memory is not the problem people think it is.
- Swap Activity The early warning sign most users ignore until it is too late.
- The Top Processes How to spot the real offender without killing the wrong thing.
Let’s start with Load Average.
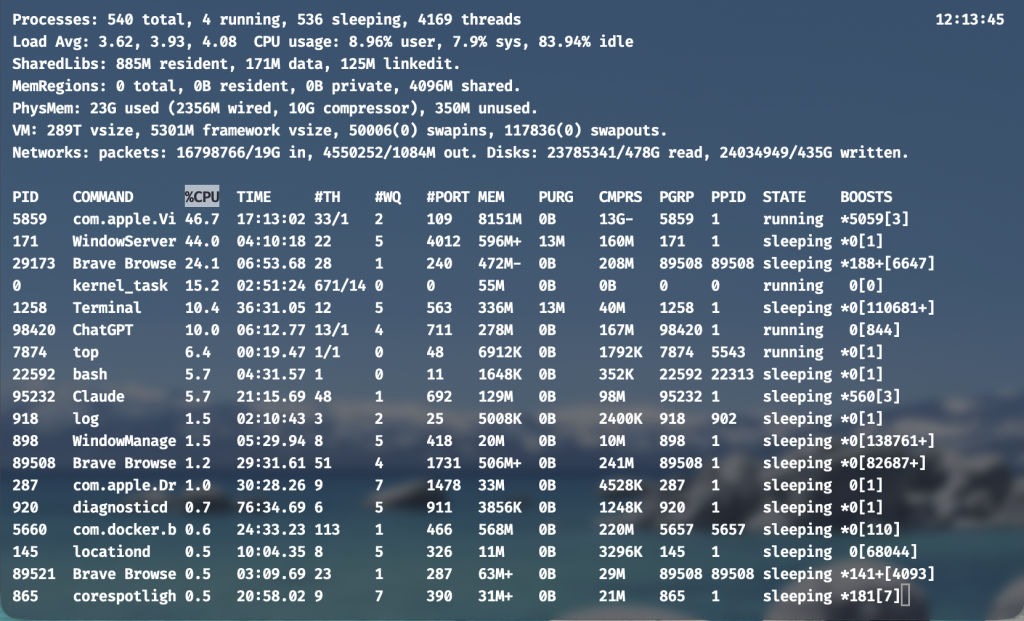
At the top right of the screen you will see something like this:
load average: 3.12, 2.85, 1.77These numbers represent system load over the last 1, 5, and 15 minutes. Think of load as pressure, not CPU usage.
This rule of thumb is simple: Compare load to your CPU core count.
- Load consistently higher than your core count means the system is under strain.
- A spike that settles quickly is usually normal.
- A rising trend across all 3 numbers means the problem is ongoing.
If load is high, something is waiting. It might be CPU. It might be disk. It might be memory. The next sections tell you which.
Next is CPU Breakdown. This line looks noisy but it is not:
%Cpu(s): 12.3 us, 4.7 sy, 82.1 id, 0.5 waYou can ignore most of it, but you should focus on these 3 fields:
us(user): application worksy(system): kernel workwa(wait): time waiting on disk or I/O
Here is the key insight. High load with high idle CPU often means I/O wait, not CPU exhaustion.
If wa is elevated, the system is blocked waiting on storage. Killing processes will not fix that. You need to investigate disk or filesystem activity.
The next item causes more panic than anything else: Memory Pressure.
MiB Mem : 15887 total, 712 free, 11452 used, 3722 buff/cacheLow free memory is not a problem by itself. Linux aggressively uses memory for caching to improve performance.
What actually matters is pressure.
- If used memory is high but swap is stable, the system is healthy.
- If free memory is low and swap is climbing, the system is under stress.
- Buffers and cache are reclaimable. Treat them as available memory.
So, should you try to “free-up” memory? Honestly, that usually just makes things worse.
Swap Activity is our #4 item. Swap tells the truth early, if you are willing to look.
MiB Swap: 2048 total, 812 free, 1236 usedOccasional swap usage is normal. Steadily increasing swap during normal workloads is not.
Rising swap usage means memory pressure has crossed a line. Performance will degrade. Latency will increase. The system will feel sluggish even if CPU usage looks fine.
If swap is growing, identify the process consuming memory before the system thrashes itself into the ground.
Finally, we’ve come to the Top Offending Processes.
Now look at the process list. That is it. This is where most people start. It should be where you finish.
Sort by CPU or memory if needed:
- Press
Pto sort by CPU - Press
Mto sort by memory
Ask yourself one question: “Does this process belong here?”
A browser tab, a runaway script, a backup job, or a misconfigured service often stands out immediately. Seeing the offender changes the conversation from “Something is wrong…” to, “I know what is wrong!”
Once you know the process, you can decide what to do next. Restart it. Reconfigure it. Investigate logs. Or leave it alone.
Putting It Together
You ran one command. In seconds, you learned:
- Whether the system is under sustained pressure
- Whether CPU, memory, or I/O is the bottleneck
- Whether swap is a warning sign or background noise
- Which process deserves attention, if any
That is why top belongs at the beginning of every performance investigation. Not in the middle. Not after a reboot.
Once you know what is hurting the system, you can decide whether you even need logs. That is where the next command earns its place.
In the next installment, we will take the offender you identified here and trace its story through the system, without drowning in the noise.
Leave a Reply
You must be logged in to post a comment.