
👨💻 Hey sysadmins! Keeping your Linux systems humming smoothly is no small feat, especially with today’s complex setups using on-prem servers, clusters, and cloud-native environments. Monitoring CPU, memory, disk, and network performance is your bread and butter, and picking the right tool can make or break your workflow.
In this guide, I’ll delve into the top 5 Linux monitoring tools for 2025—Zabbix, Prometheus, Nagios, htop, and vnstat. I’ll compare their features, walk you through installation with CLI commands, and help you pick the best fit for your needs. Plus, stick around for a fun quiz to find your perfect tool! 🛠️
Why Monitoring Matters 🔍
As systems grow, so do the stakes. A February 2025 nixCraft article listed 30 must-have tools, and Linux Journal recently highlighted server monitoring challenges—proof that sysadmins are always on the hunt for better ways to track performance. Whether you’re managing a single VPS or a Kubernetes cluster, these tools will keep you ahead of crashes, bottlenecks, and resource hogs. Let’s break down the top 5! 📊
Comparison Table: The Big Picture 📋
Here’s a quick snapshot of my top 5 tools, comparing their strengths, use cases, and setup complexity.
| Tool | Real-Time Monitoring | Alerting | Scalability | Best Use Case | Setup Complexity |
|---|---|---|---|---|---|
| Zabbix | ✅ | ✅ | High | Enterprise-grade monitoring | Moderate |
| Prometheus | ✅ | ✅ | Very High | Cloud-native & microservices | Moderate |
| Nagios | ✅ | ✅ | Moderate | Small to medium infrastructures | Moderate |
| htop | ✅ | ❌ | Low | Quick, interactive server checks | Low |
| vnstat | ✅ | ❌ | Low | Network bandwidth monitoring | Low |
Now, let’s dive into each tool with setup guides, sample outputs, and tips for sysadmins! 🖥️
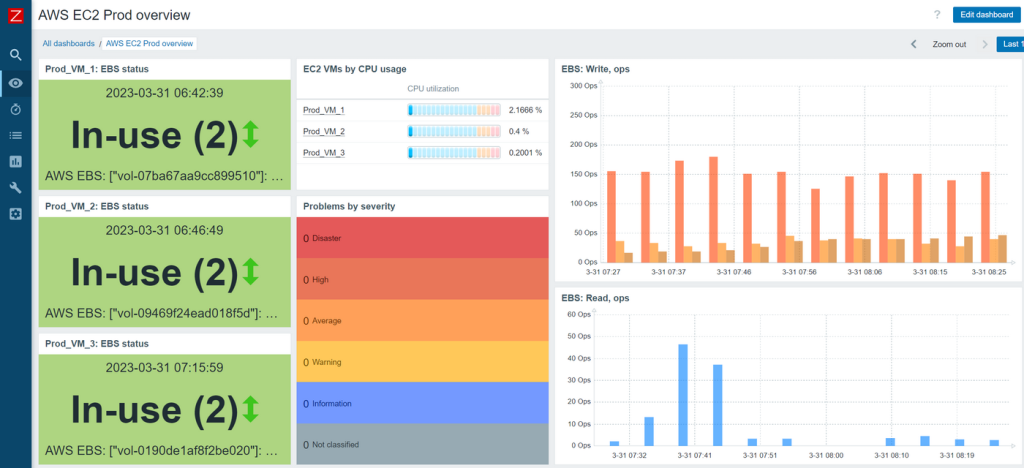
1. Zabbix: The Enterprise Heavyweight 🏢
What It Does: Zabbix is a robust, open-source monitoring platform for servers, networks, and applications. It’s perfect for sysadmins needing detailed dashboards, alerting, and scalability for large environments.
Strengths:
- Comprehensive monitoring (CPU, memory, disk, network, apps) 📈
- Customizable dashboards and real-time alerts via email/SMS 📩
- Scales well for enterprise setups with multiple servers
Use Case: Ideal for sysadmins managing data centers or complex infrastructures needing centralized monitoring.
Installation (Ubuntu/Debian):
sudo apt update && sudo apt install -y zabbix-agent zabbix-server-mysql zabbix-frontend-php
sudo systemctl enable zabbix-server zabbix-agent
sudo systemctl start zabbix-server zabbix-agent
📌Pro Tip: Configure the web interface at http://your-server/zabbix and set up MySQL for data storage. Check the Zabbix docs for details.
Why You’ll Love It: Zabbix’s alerting and visualizations make it a one-stop shop for enterprise sysadmins. ⚙️
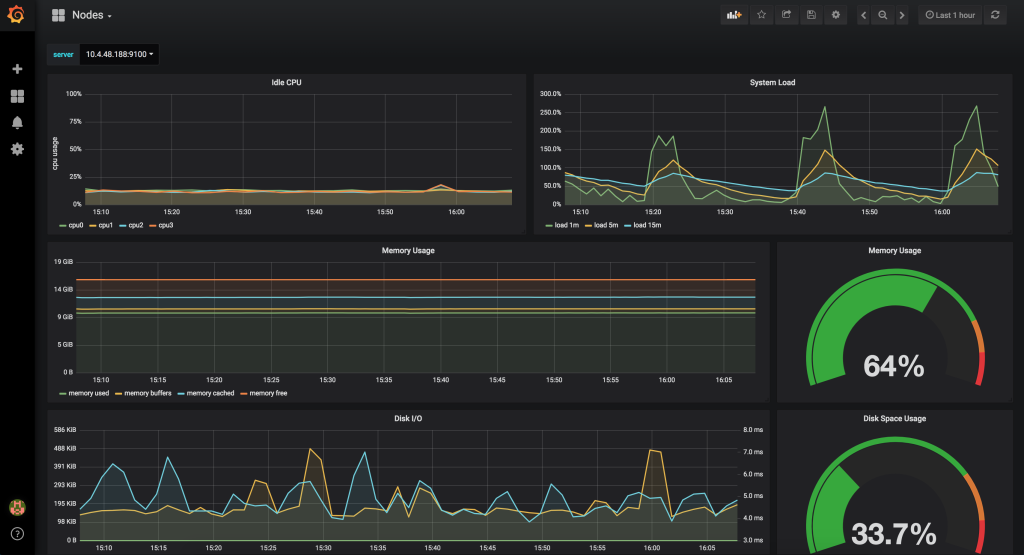
2. Prometheus: The Cloud-Native Champion ☁️
What It Does: Prometheus is a time-series database with powerful querying (PromQL) and integration with Grafana for stunning dashboards. It’s a favorite for cloud-native setups like Kubernetes.
Strengths:
- Excels in dynamic environments (containers, microservices) 🐳
- Flexible alerting with Alertmanager 🚨
- Huge community and plugin ecosystem
Use Case: Perfect for sysadmins running cloud-native apps or containerized workloads.
Installation (Ubuntu/Debian):
wget https://github.com/prometheus/prometheus/releases/download/v2.47.0/prometheus-2.47.0.linux-amd64.tar.gz
tar xvfz prometheus-*.tar.gz
cd prometheus-*
sudo mv prometheus /usr/local/bin/
sudo prometheus --config.file=prometheus.yml &
📌Pro Tip: Pair with Grafana for visualizations. Edit prometheus.yml to scrape your targets.
Why You’ll Love It: Prometheus shines in modern, scalable environments with its query power. 🌟
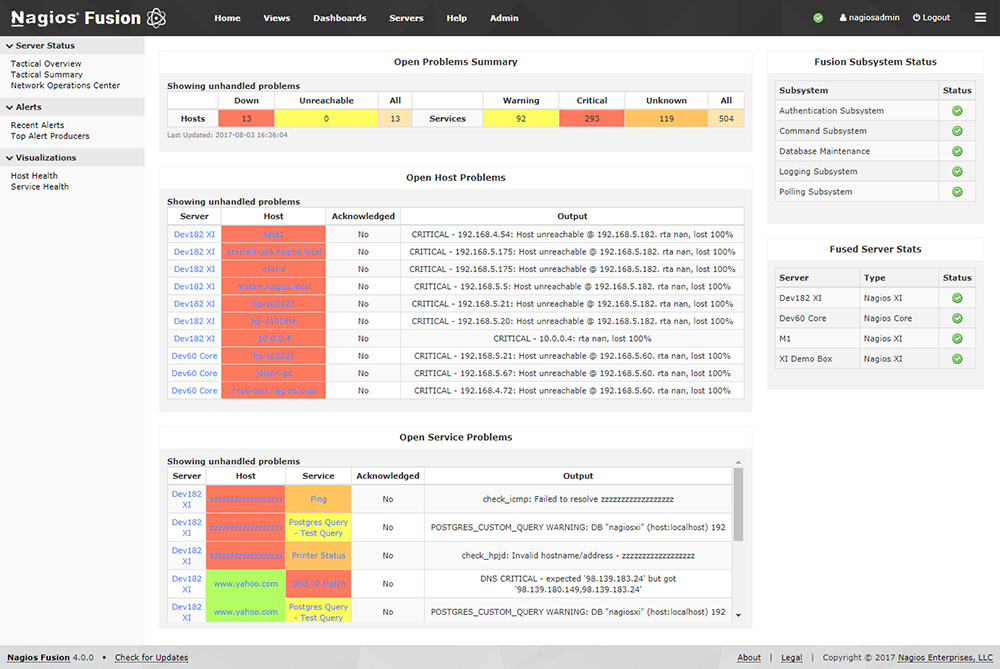
3. Nagios: The Classic Workhorse 🐎
What It Does: Nagios is a veteran monitoring tool for servers, networks, and services, offering robust alerting and a plugin ecosystem.
Strengths:
- Reliable for small to medium setups 🖧
- Extensive plugin library for custom checks 🔌
- Email and SMS alerts for quick response
Use Case: Great for sysadmins managing traditional server farms or SMB infrastructures.
Installation (CentOS/RHEL):
sudo yum install -y epel-release
sudo yum install -y nagios nagios-plugins-all
sudo systemctl enable nagios
sudo systemctl start nagios
📌Pro Tip: Access the web interface at http://your-server/nagios and configure checks in /etc/nagios/objects.
Why You’ll Love It: Nagios’s simplicity and reliability make it a go-to for traditional setups. 🛡️
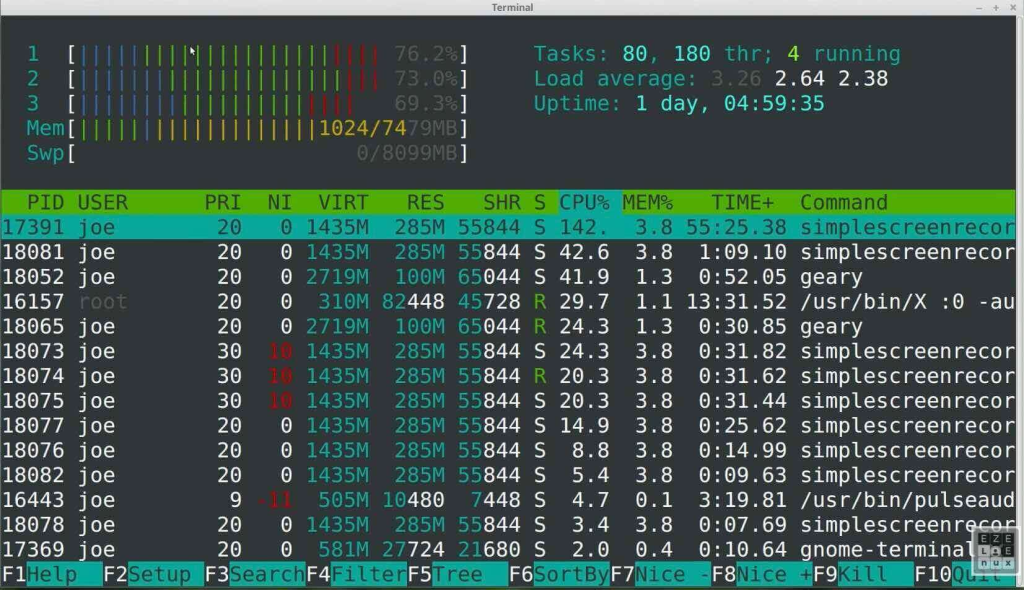
4. htop: The Interactive Powerhouse 🖥️
What It Does: htop is a terminal-based, interactive system monitor that’s lightweight and perfect for quick server checks.
Strengths:
- Real-time, colorful interface for CPU, memory, and processes 🎨
- No complex setup—run and go! 🚀
- Great for single-server troubleshooting
Use Case: Ideal for super users needing a fast, hands-on tool for one-off server diagnostics.
Installation (Any Linux Distro):
sudo apt install -y htop  # Ubuntu/Debian
sudo dnf install -y htop  # Fedora
sudo pacman -S htop       # Arch
📌Pro Tip: Press F5 in htop for a tree view of processes or F3 to search.
Why You’ll Love It: htop’s simplicity and interactivity are perfect for quick checks. 😎
5. vnstat: The Network Bandwidth Guru 📡
What It Does: vnstat is a lightweight tool for monitoring network bandwidth usage, ideal for tracking data transfer on servers.
Strengths:
- Minimal resource usage ⚡
- Tracks bandwidth over time (daily, monthly) 📅
- Simple CLI output for scripting
Use Case: Best for sysadmins focused on network performance or bandwidth-limited environments.
Installation (Ubuntu/Debian):
sudo apt update && sudo apt install -y vnstat
sudo systemctl enable vnstat
sudo systemctl start vnstat
vnstat -i eth0  # Monitor specific interface
📌Pro Tip: Use vnstat -m for monthly stats or vnstat -h for hourly breakdowns.
Sample Output:
$ vnstat -i eth0
  eth0  /  daily
         day         rx      |     tx      |    total
  -----------------------------+----------------------------
   06/29/25     1.23 GiB  |  0.89 GiB  |  2.12 GiB
Why You’ll Love It: vnstat’s lightweight design and focus on network stats make it a sysadmin’s secret weapon. 🌐
Wrapping Up: Pick Your Tool and Monitor Like a Pro! 🏆
Whether you’re running a massive data center (Zabbix, Prometheus), a small server farm (Nagios), or just need quick checks (htop, vnstat), these tools have you covered. Here’s a quick recap:
- Zabbix: Enterprise-grade, all-in-one monitoring 🏢
- Prometheus: Cloud-native, scalable, and query-driven ☁️
- Nagios: Reliable for small to medium setups 🐎
- htop: Fast, interactive, and lightweight 🖥️
- vnstat: Network bandwidth tracking made simple 📡
What’s your go-to Linux monitoring tool, and why? Drop a comment below—we’d love to hear your setup! 🙌 Stay vigilant, sysadmins, and keep those servers purring! 😺
Leave a Reply
You must be logged in to post a comment.